US airport on-time ranking: the 30 busiest airports, July 2025 to June 2026
Published by FlyingOver Editorial Team · Last checked:
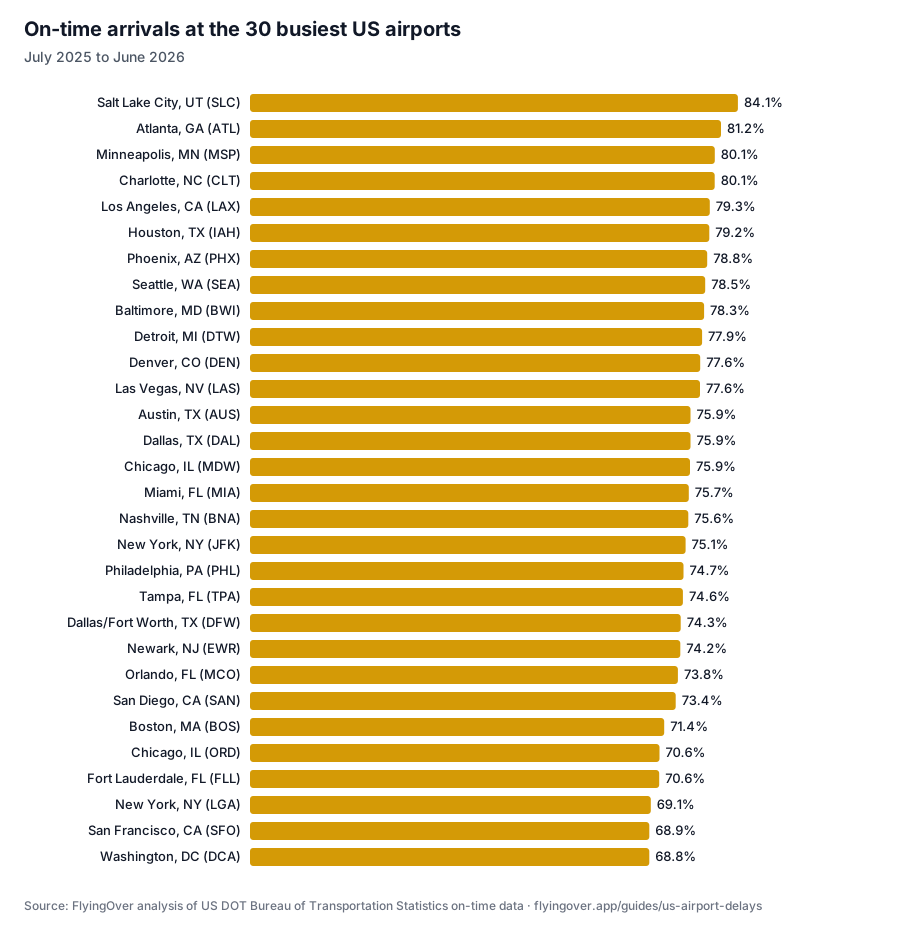
From July 2025 to June 2026, Salt Lake City, UT (SLC) had the best on-time arrival record of the 30 busiest US airports, with 84.1% of scheduled arrivals on time. Washington, DC (DCA) had the worst, at 68.8%. Across all airports, 76.0% of scheduled flights arrived on time; in June 2026 alone, 72.8% did.
This page is updated every month when the US Department of Transportation publishes new data. It ranks airports, not airlines, using every domestic flight reported to the Department.
On-time ranking of the 30 busiest US airports
Ranked by the share of scheduled arrivals that reached the gate less than 15 minutes late over the last 12 months. The busiest airports are the 30 with the most scheduled departures in that period.
| Rank | Airport | Arrivals on time | Departures on time | Canceled | Arrivals on time, June 2026 |
|---|---|---|---|---|---|
| 1 | Salt Lake City, UT (SLC) | 84.1% | 84.0% | 0.8% | 82.1% |
| 2 | Atlanta, GA (ATL) | 81.2% | 77.3% | 1.7% | 81.9% |
| 3 | Minneapolis, MN (MSP) | 80.1% | 79.7% | 1.4% | 79.4% |
| 4 | Charlotte, NC (CLT) | 80.1% | 74.3% | 2.0% | 78.0% |
| 5 | Los Angeles, CA (LAX) | 79.3% | 79.3% | 0.9% | 74.9% |
| 6 | Houston, TX (IAH) | 79.2% | 77.7% | 1.1% | 73.6% |
| 7 | Phoenix, AZ (PHX) | 78.8% | 76.3% | 0.9% | 73.5% |
| 8 | Seattle, WA (SEA) | 78.5% | 78.0% | 1.0% | 76.9% |
| 9 | Baltimore, MD (BWI) | 78.3% | 71.8% | 1.7% | 75.4% |
| 10 | Detroit, MI (DTW) | 77.9% | 77.5% | 1.8% | 79.0% |
| 11 | Denver, CO (DEN) | 77.6% | 75.2% | 0.8% | 72.4% |
| 12 | Las Vegas, NV (LAS) | 77.6% | 74.0% | 0.9% | 70.0% |
| 13 | Austin, TX (AUS) | 75.9% | 74.4% | 1.2% | 68.4% |
| 14 | Dallas, TX (DAL) | 75.9% | 67.9% | 1.4% | 62.6% |
| 15 | Chicago, IL (MDW) | 75.9% | 71.2% | 1.5% | 68.8% |
| 16 | Miami, FL (MIA) | 75.7% | 72.9% | 1.6% | 76.9% |
| 17 | Nashville, TN (BNA) | 75.6% | 71.7% | 1.5% | 69.3% |
| 18 | New York, NY (JFK) | 75.1% | 76.0% | 3.1% | 74.1% |
| 19 | Philadelphia, PA (PHL) | 74.7% | 74.4% | 2.6% | 75.0% |
| 20 | Tampa, FL (TPA) | 74.6% | 76.4% | 1.5% | 73.9% |
| 21 | Dallas/Fort Worth, TX (DFW) | 74.3% | 68.9% | 3.0% | 67.2% |
| 22 | Newark, NJ (EWR) | 74.2% | 77.1% | 3.0% | 77.1% |
| 23 | Orlando, FL (MCO) | 73.8% | 72.5% | 1.7% | 72.3% |
| 24 | San Diego, CA (SAN) | 73.4% | 74.2% | 1.3% | 64.8% |
| 25 | Boston, MA (BOS) | 71.4% | 74.8% | 2.6% | 74.4% |
| 26 | Chicago, IL (ORD) | 70.6% | 70.9% | 2.7% | 71.3% |
| 27 | Fort Lauderdale, FL (FLL) | 70.6% | 69.2% | 2.2% | 73.9% |
| 28 | New York, NY (LGA) | 69.1% | 72.7% | 4.6% | 69.8% |
| 29 | San Francisco, CA (SFO) | 68.9% | 76.2% | 1.0% | 48.3% |
| 30 | Washington, DC (DCA) | 68.8% | 71.1% | 3.7% | 67.7% |
What delays flights
When a flight arrives 15 minutes or more late, the airline reports how many minutes of the delay came from each cause. Across all US airports from July 2025 to June 2026, delay minutes broke down like this:
| Cause | Share of delay minutes |
|---|---|
| Late-arriving aircraft | 39.6% |
| Airline (crew, maintenance, baggage, cleaning, fueling) | 33.2% |
| Air traffic system (non-extreme weather, heavy traffic, air traffic control) | 20.8% |
| Extreme weather | 6.2% |
| Security | 0.1% |
A late-arriving aircraft means the plane was already late from its previous flight. Read where is my plane coming from?
The best time of day to fly
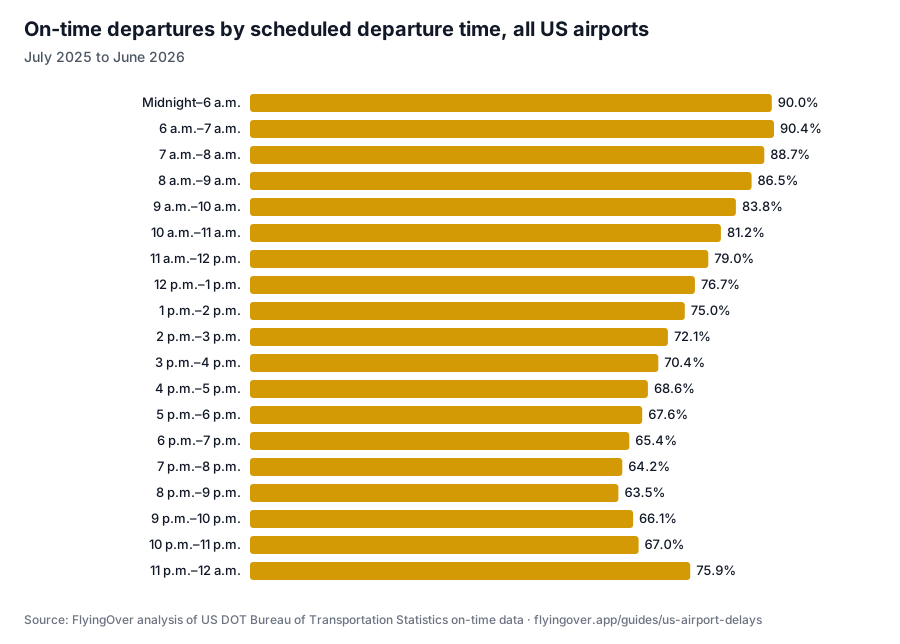
Flights scheduled to leave early in the day are the most likely to leave on time: 90.4% of flights departing 6 a.m.–7 a.m. left on time, against 63.5% in the 8 p.m.–9 p.m. slot. Delays tend to build during the day: when an aircraft arrives late, the FAA notes, the delay ripples on to its next flights.
| Scheduled departure | Departures on time | Canceled |
|---|---|---|
| Midnight–6 a.m. | 90.0% | 1.7% |
| 6 a.m.–7 a.m. | 90.4% | 1.8% |
| 7 a.m.–8 a.m. | 88.7% | 1.5% |
| 8 a.m.–9 a.m. | 86.5% | 1.4% |
| 9 a.m.–10 a.m. | 83.8% | 1.3% |
| 10 a.m.–11 a.m. | 81.2% | 1.5% |
| 11 a.m.–12 p.m. | 79.0% | 1.4% |
| 12 p.m.–1 p.m. | 76.7% | 1.5% |
| 1 p.m.–2 p.m. | 75.0% | 1.4% |
| 2 p.m.–3 p.m. | 72.1% | 1.6% |
| 3 p.m.–4 p.m. | 70.4% | 1.8% |
| 4 p.m.–5 p.m. | 68.6% | 1.9% |
| 5 p.m.–6 p.m. | 67.6% | 2.2% |
| 6 p.m.–7 p.m. | 65.4% | 2.4% |
| 7 p.m.–8 p.m. | 64.2% | 2.6% |
| 8 p.m.–9 p.m. | 63.5% | 2.4% |
| 9 p.m.–10 p.m. | 66.1% | 2.7% |
| 10 p.m.–11 p.m. | 67.0% | 2.8% |
| 11 p.m.–12 a.m. | 75.9% | 1.6% |
Month by month
| Month | Arrivals on time, all US airports | Canceled |
|---|---|---|
| July 2025 | 69.0% | 2.5% |
| August 2025 | 76.3% | 1.1% |
| September 2025 | 82.8% | 0.5% |
| October 2025 | 79.1% | 0.5% |
| November 2025 | 77.3% | 2.5% |
| December 2025 | 71.9% | 1.5% |
| January 2026 | 75.3% | 4.7% |
| February 2026 | 78.3% | 2.3% |
| March 2026 | 73.2% | 2.9% |
| April 2026 | 78.9% | 0.9% |
| May 2026 | 77.6% | 0.9% |
| June 2026 | 72.8% | 1.6% |
How these numbers are calculated
- Data: the Bureau of Transportation Statistics' reporting carrier on-time data, which lists every domestic flight operated by the US airlines that report on-time performance to the Department of Transportation. It's public domain.
- On time: arriving at (or leaving) the gate less than 15 minutes after the scheduled time, the federal definition.
- Shares of scheduled flights: canceled and diverted flights count as not on time, so the three columns show what happened to every flight that was scheduled.
- Arrivals and departures are counted at each airport separately: an arrival counts for the destination airport, a departure for the origin.
- Delay causes are shares of the delay minutes reported for flights that arrived 15 minutes or more late.
- Airports, not airlines: this page aggregates flights by airport only.
- Small differences from official totals: the Bureau's own published percentages group flights by marketing and codeshare airline, so its national figures can differ slightly from ours (by a few tenths of a point in recent months).
To cite this page: FlyingOver analysis of US DOT Bureau of Transportation Statistics on-time data, July 2025 to June 2026, flyingover.app/guides/us-airport-delays.
Plan for delays
A delay at one of these airports matters most when you have a connection. Read is a 1-hour layover enough? and ground stop vs. ground delay. Add your flights to FlyingOver before you travel to see status and gate changes, and follow your flight offline in the air.
Sources
- US Department of Transportation, Bureau of Transportation Statistics, Reporting Carrier On-Time Performance data: Flight-level on-time, cancellation, diversion and delay-cause data for July 2025 to June 2026, analyzed by FlyingOver. (September 17, 2026)
- 14 CFR part 234 (US Department of Transportation), airline service quality performance reports: On time means arriving at the gate less than 15 minutes after the scheduled time; delay-cause categories. (September 17, 2026)
- Federal Aviation Administration, Aviation System Performance Metrics, types of delay: A late arrival delays the same aircraft's later flights; the FAA calls this ripple effect delay propagation. (September 17, 2026)
- Bureau of Transportation Statistics, airline on-time statistics and delay causes: Official national on-time and delay-cause statistics to compare against. (September 17, 2026)
This article was written based on official sources (see sources). These sources may change over time, and the article may not be updated, so we recommend checking directly with the source or the airline.
Related guides
- Where is my plane coming from? Why the inbound mattersA late incoming aircraft is the biggest single cause of US flight delays. How it works, how to find your inbound flight, and what to do when it runs late.
- US customs wait times by airport: passport control linesAverage passport control wait times at US international airports, for US citizens and visitors, by hour and month, from CBP data. Updated monthly.
- Is a 1-hour layover enough? How to tell before you bookWhen a 45-minute or 1-hour layover works in the US, when it doesn't, and the questions to ask about terminals, customs, bags and separate tickets.
- Scheduled, estimated, landed: flight status terms explainedWhat scheduled, estimated and actual times mean, why landed isn't arrived, how US on-time is measured and what the official delay causes mean.